The Netherlands runs one of the densest rail networks in Europe, with 20+ operators sharing the tracks. Delays are a daily experience, but as a passenger you never learn why: weather, one bad operator, a corridor bottleneck, or a disruption cascading through the network.
NL Transport Pulse is my attempt to answer that with data: a pipeline that ingests 70M+ train departures (2019 to 2026), 15 years of disruption records, and daily weather observations, transforms them through a medallion architecture on GCP, and serves an interactive dashboard for corridor-level reliability analysis. It started as my capstone for the DataTalksClub DE Zoomcamp 2026.
Code: github.com/xlsongc/nl-transport-pulse
Architecture
flowchart LR
    subgraph Sources
        NS[NS API<br/>4x daily]
        RDT[RDT archives<br/>monthly]
        KNMI[KNMI weather<br/>daily]
    end
    subgraph Orchestration["Airflow (6 DAGs)"]
        ING[ingest DAGs]
        DBT[dbt DAG<br/>run + test]
    end
    NS --> ING
    RDT --> ING
    KNMI --> ING
    ING --> GCS[(GCS<br/>raw archive)]
    GCS --> BQ[(BigQuery<br/>raw)]
    BQ --> DBT
    DBT --> CORE[(BigQuery<br/>staging / core)]
    CORE --> ST[Streamlit<br/>4 dashboard pages]
    TF[Terraform] -.provisions.-> GCS
    TF -.provisions.-> BQ
Everything reproducible from a clean machine: Terraform provisions the GCS bucket, BigQuery datasets, and service account; Docker Compose brings up Airflow and Streamlit; the DAGs and dbt do the rest.
| Layer | Tool |
|---|---|
| Infrastructure | Terraform |
| Orchestration | Airflow 2.8 (Docker Compose) |
| Lake / Warehouse | GCS + BigQuery (partitioned, clustered) |
| Transformation | dbt Core: staging, intermediate, core + seeds, snapshot, macros |
| Serving | Streamlit + Plotly |
Three decisions worth explaining
1. Idempotent loads: partition-scoped overwrite
Every ingestion path writes raw files to GCS first, then loads into BigQuery with the same contract: delete the partition for that service date, then load. Re-running any day, whether after a failure or a backfill, converges to the same state instead of duplicating rows.
def load_json_to_bq(gcs_uri, table_id, service_date,
                    partition_field="_service_date", skip_delete=False):
    """Partition-scoped overwrite:
    1. Delete all rows for the given service_date
    2. Load new data from GCS
    """
Airflow retries become safe by construction, not by hoping a run never dies halfway.
2. Polling instead of streaming, deduplication in dbt
The NS departures API is a live board, so I poll it 4 times a day rather than streaming. That is a deliberate scope cut: for daily reliability analytics, intraday latency buys nothing. The cost is overlap between polls, which is resolved in the staging layer with row_number() ordered by ingestion time:
qualify row_number() over (
    partition by departure_id
    order by _ingested_at desc
) = 1
Each staging model also builds a surrogate key and casts every field explicitly, because the raw API mixes JSON strings into otherwise flat records:
cast(json_extract_scalar(product, '$.operatorName') as string) as operator_name,
timestamp_diff(timestamp(actualDateTime),
               timestamp(plannedDateTime), MINUTE) as delay_minutes,
3. Tests as part of the DAG, not a chore after it
The dbt DAG runs dbt test right after dbt run, with 26 schema tests across the three layers (uniqueness of surrogate keys, accepted values for delay categories, relationships between facts and dimensions). Two data quality bugs this caught early: RDT delay values are documented in minutes but look like seconds at first glance, and disruption durations needed cross-validation against their start and end timestamps.
The dashboard
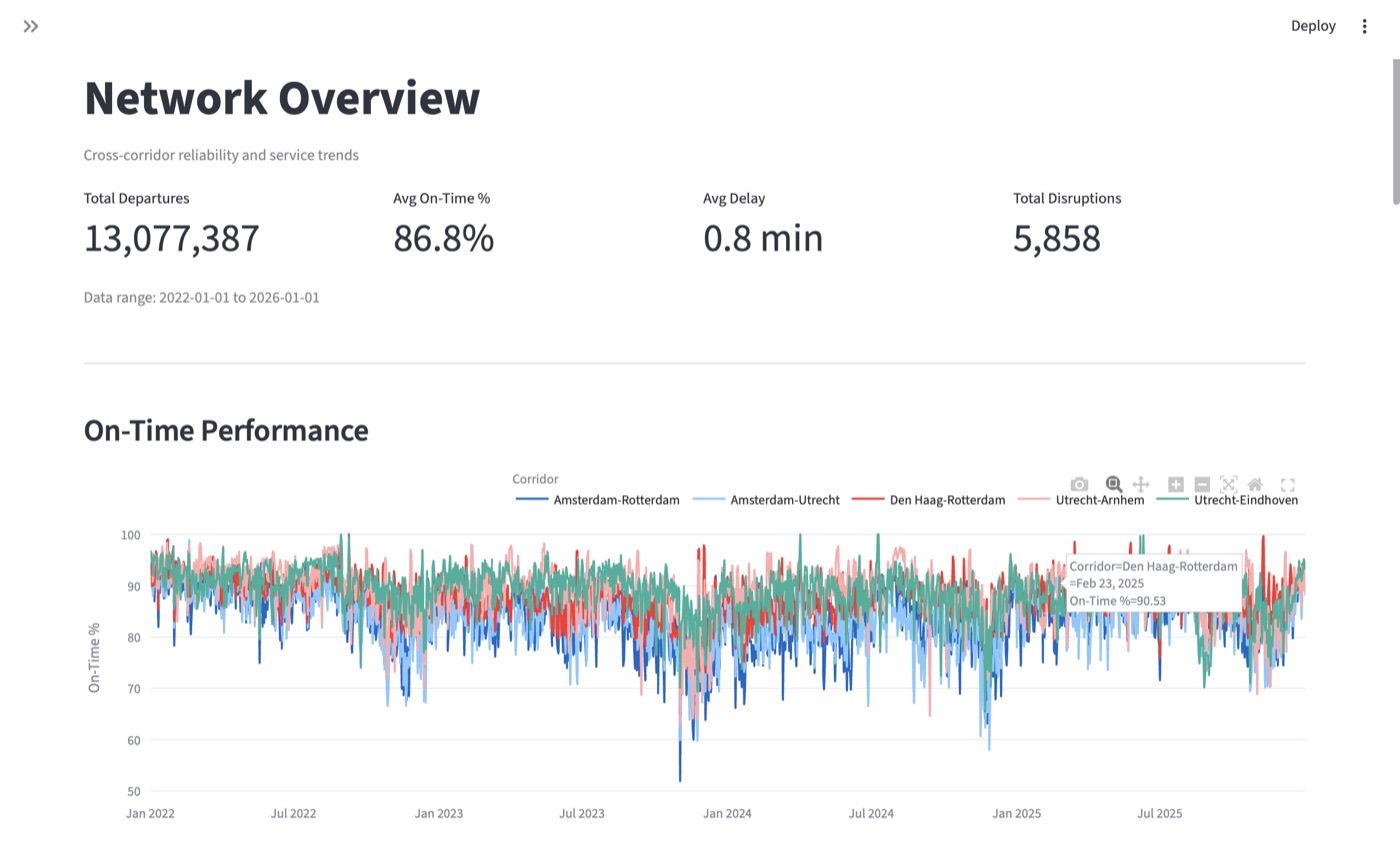
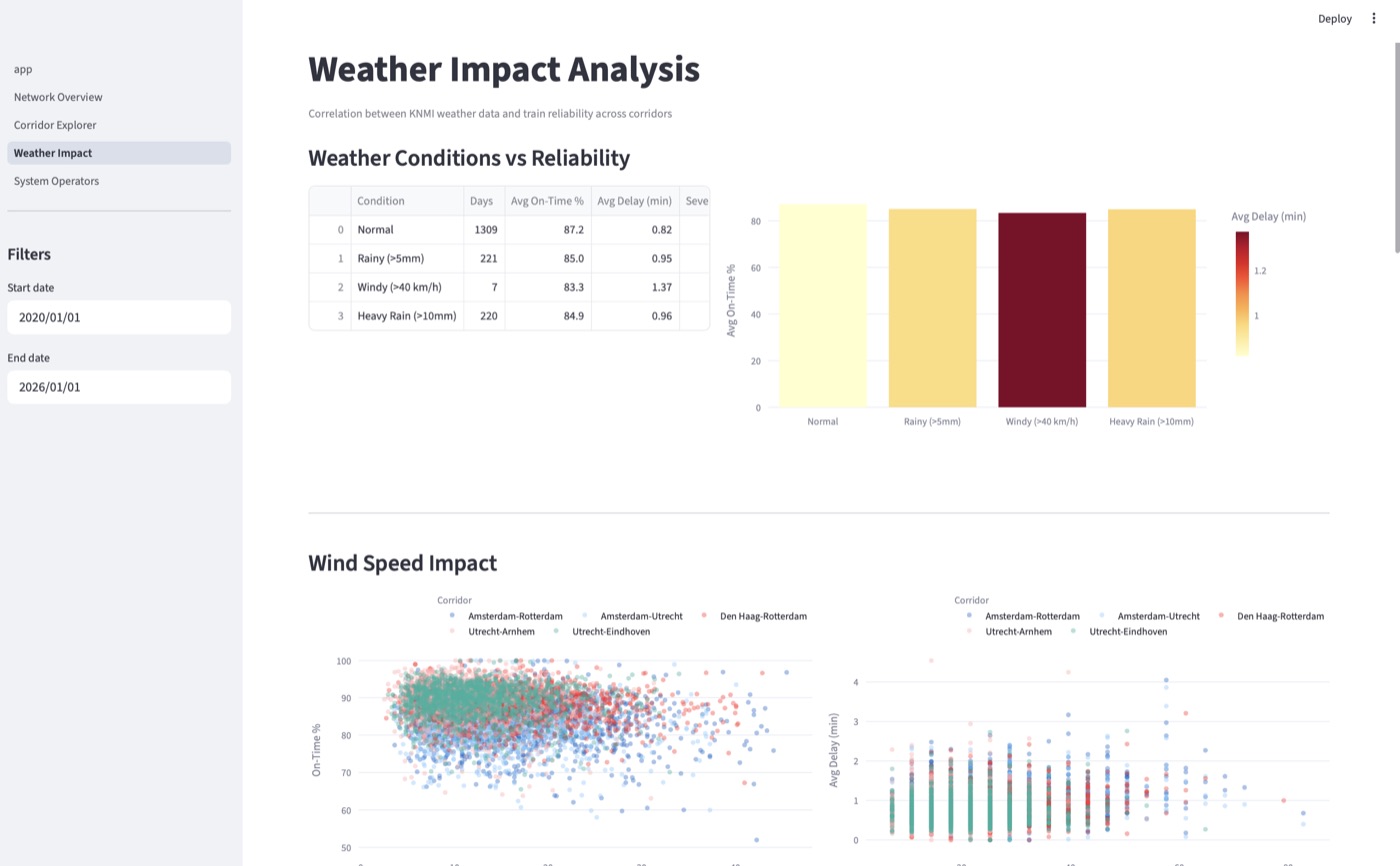
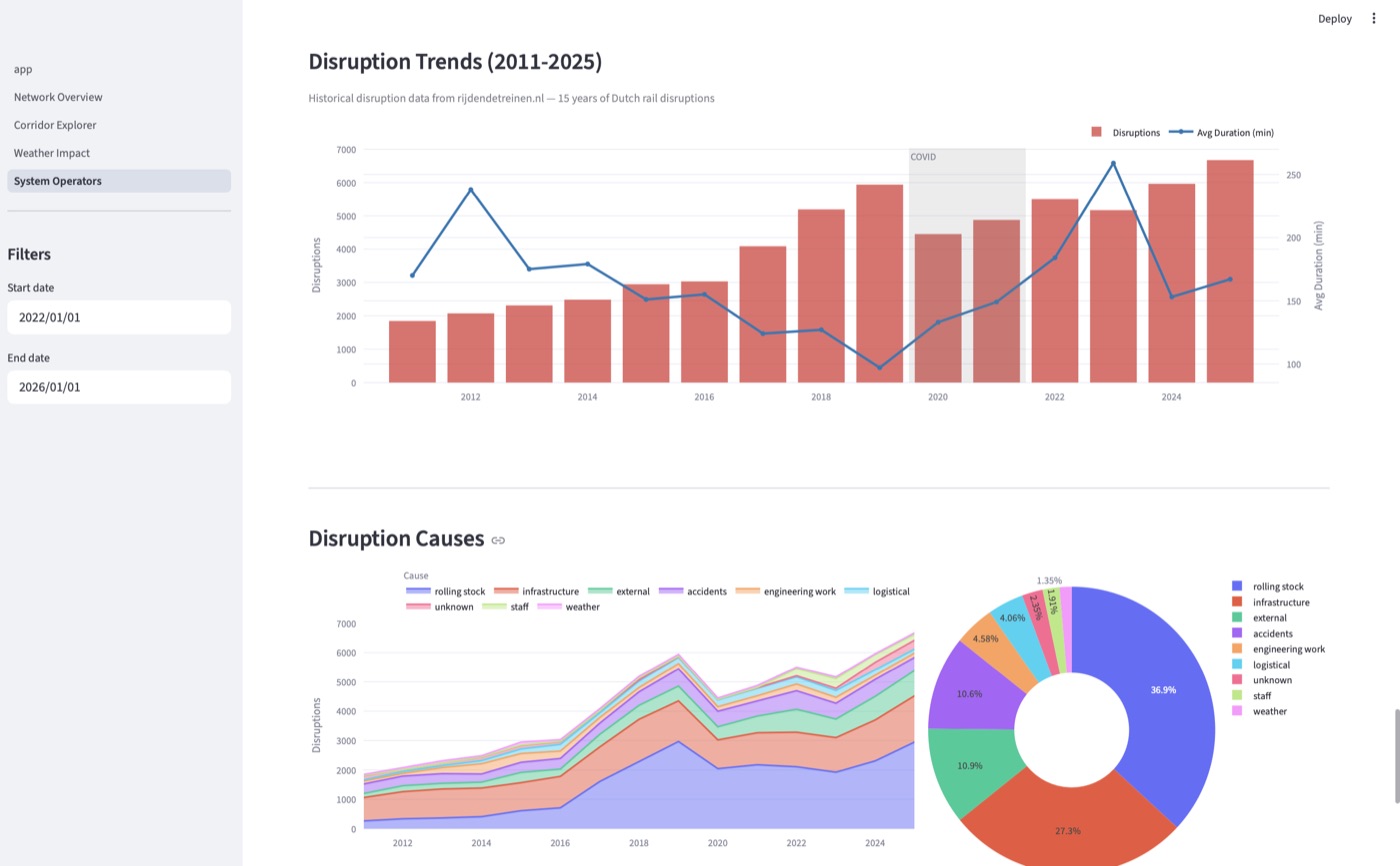
Four Streamlit pages on top of the core marts: a network overview (reliability trends, stress map, calendar heatmap), a corridor explorer, a weather impact page (wind, rain, and temperature against on-time performance), and an operator view covering 26 rail companies plus 15 years of disruption history.
Honest limitations
- The NS polling path captures snapshots, not a complete event stream; the complete history comes from the monthly RDT archives, and the two are unioned in the intermediate layer.
- Road traffic data (NDW) is scaffolded as a future extension but not part of the verified end-to-end path.
- The dashboard queries BigQuery directly with caching; at real scale a serving layer would sit in between.
What I took from it
The individual tools are all learnable in a weekend each. The actual work, and the actual learning, sits in the seams: making loads idempotent so orchestration retries are safe, deciding where deduplication belongs, and wiring tests into the pipeline so data quality problems surface on day one instead of in a dashboard six weeks later.